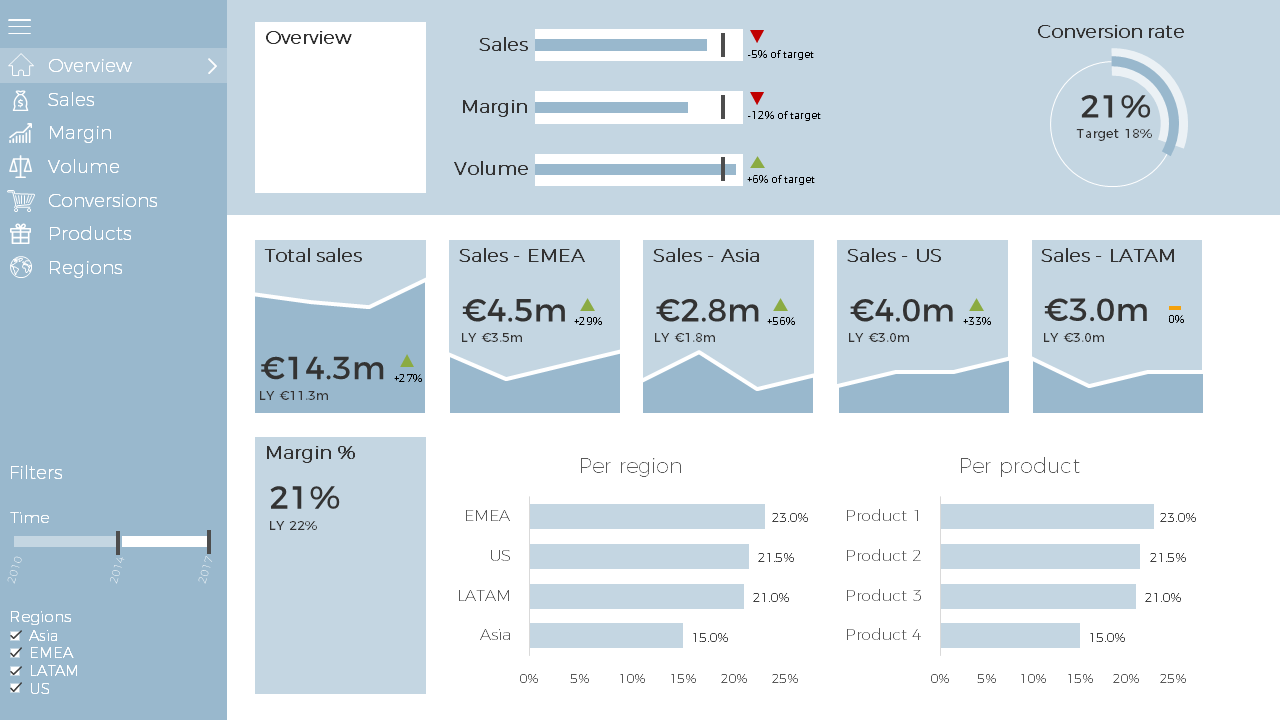
The dashboard below is an example focusing on sales, margins, volumes and conversions. There are two more views specifically focusing on the performance of the products and the regions.
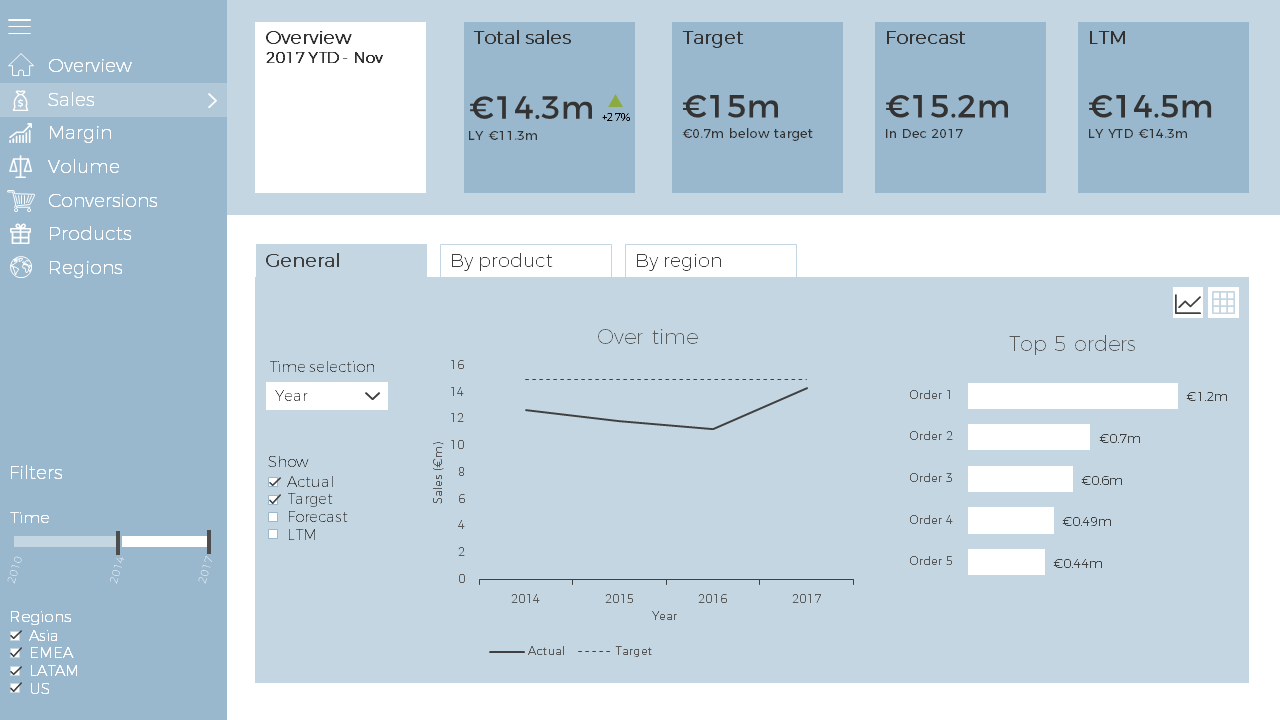
Usually, the first page of a dashboard contains the most important KPI’s. You can navigate through the dashboard using the menu on the left. Each page shows the most important trends and figures.
The purpose of a dashboard is to view the most important KPI’s and results at a glance. Dashboards are an interactive way to see how the company or project perform.
By using dashboards, you will discover the right insights in an easy way. You can apply filters yourself and consult different graphs. By immediately having the right information available, correct decisions can be made.
On average, the development of a dashboard takes 2 weeks – 2 months. The development consists of two phases: